


Master skillset. Build Portfolio. Get Certified!
Master in-demand MS Excel Data Analytics skills through our intensive training program


You've invested in so many courses but provided little to no results. We understand your struggles.
You're seeking for high-quality curriculum, beginner-friendly concepts, and practical approach through real-world project-based.
Whether you're a recent graduate, looking to shift careers, aiming for professional development, or seeking a freelance income stream, we've got you covered.
Whether YOU ARE career shifter, searching for an extra source of income, or aiming to enhance your skillset, our training program offers a comprehensive path from beginners to advanced in the art of Data Analytics to master data analytics skillset.
Build solid portfolio and showcase your practical skills, problem-solving skills, and the ability to turn data insights into action. Make a lasting impression on employers and prove your competence in the competitive field of data analysis.
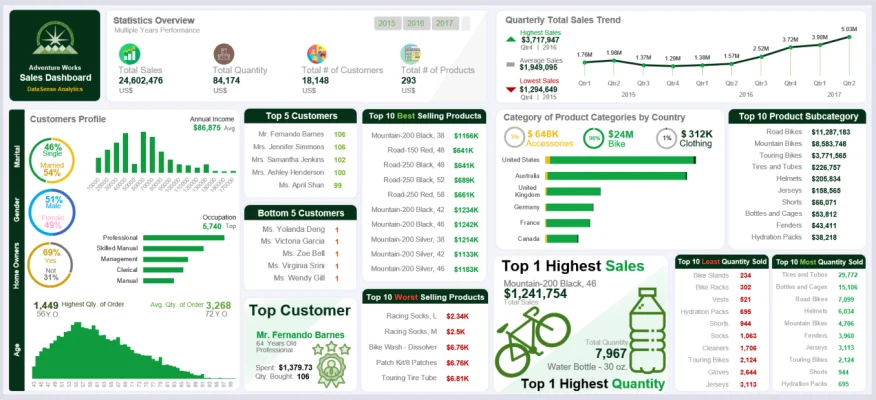
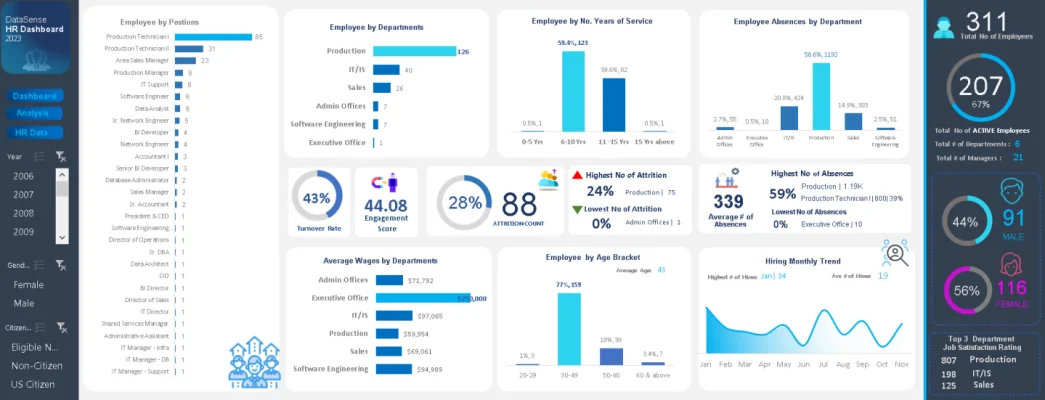
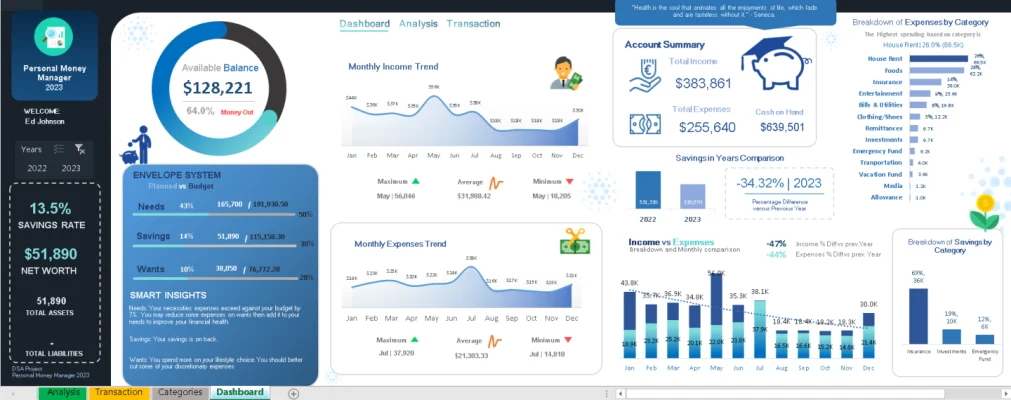
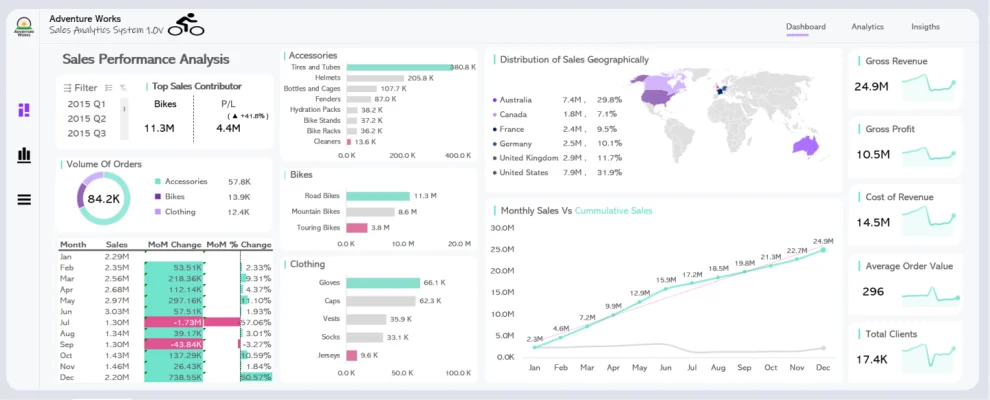
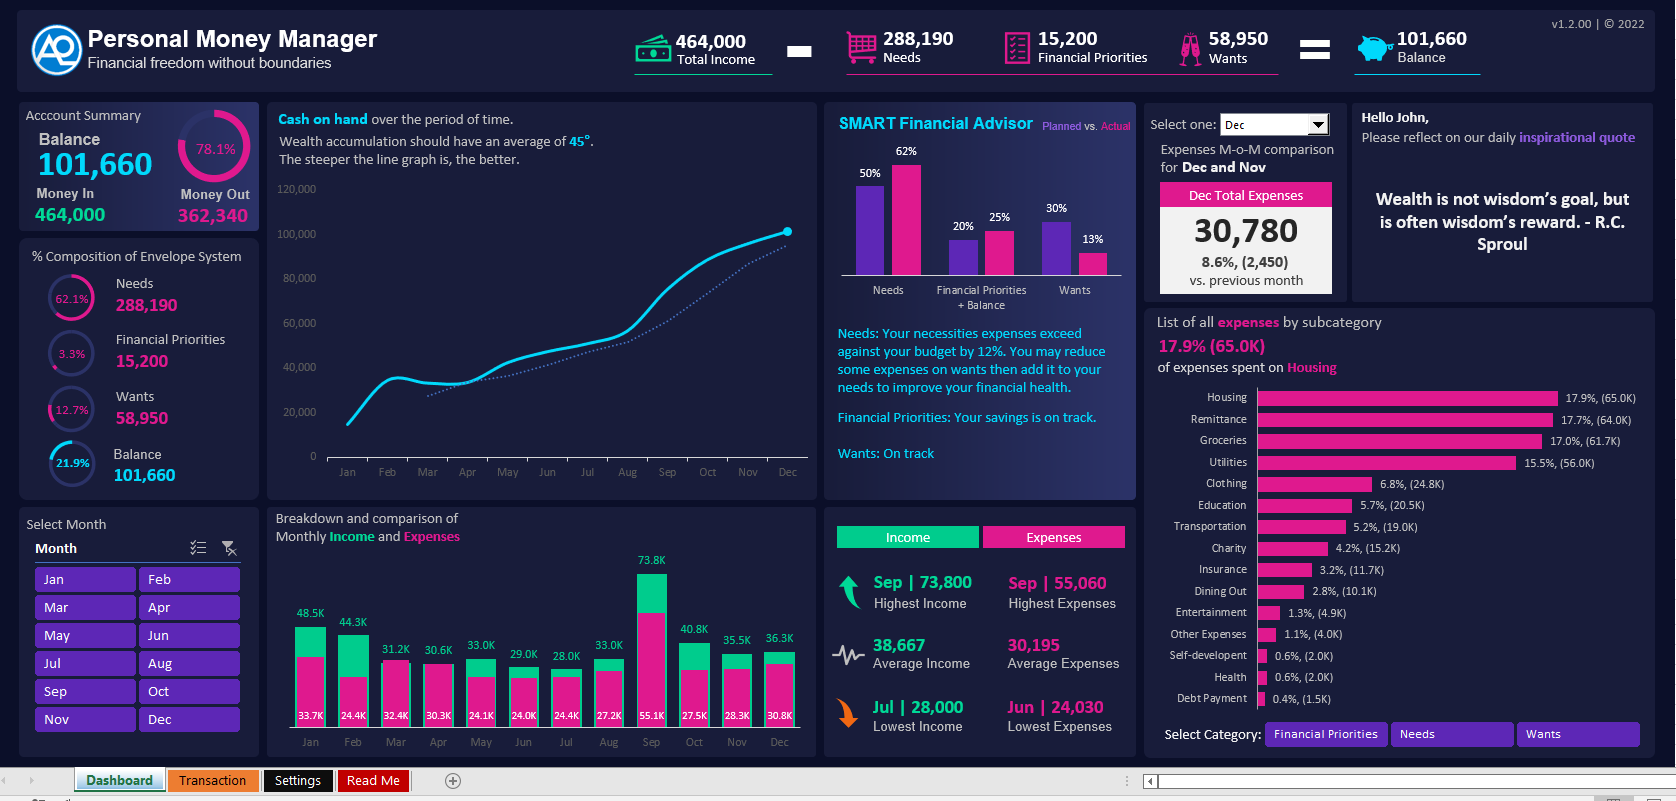
Witness the imaginative prowess of our students as they craft visually stunning and impactful dashboards, inspiring you to transform data into compelling stories of success.

Easy-to-follow lessons suitable for those new to data analytics. From Beginner to Advanced (All Levels)
Instructor-led live training program. Guidance and teaching provided by a qualified instructor in a structured and live interactive manner.
Highly skilled and experienced mentors at the forefront of their field, offering exceptional guidance and expertise
Live Q&A to ensure that you grasp the lessons via Zoom. Real-time interactive sessions where participants can ask questions and receive immediate responses from our mentor.
A practical and hands-on project that mirrors real-life scenarios and challenges, allowing participants to apply their knowledge and skills in a meaningful real-world context.
Lifetime access to all lessons and training materials.
Jan 28 to Feb 07, 2025
(Wednesday, Friday & Saturday)
6-Day Session
7:00PM to 10:00PM PH TIME
100% Online.
Live via Zoom on all Core Course
with lifetime access to all replays and Materials
Instructor-led Training Program.
With asynchronous training on elective course.
With our MS Excel Data Analyst Professional Certificate Masterclass Core Modules, start your transformative journey into the world of data analysis with our intensive training. Designed to equip you with the essential skills and knowledge. This masterclass comprises 8 core modules that cover the fundamentals and advanced concepts of data analysis.
Core Courses: These are required courses that all learners in a particular program must take.
Elective Courses: These are courses that learners can choose to take based on their interests. To get the full potential of the program we highly suggest to take elective course too.
Explore the core foundations of data analytics with our concise and comprehensive guide. Covering essential concepts, methodologies, and applications, this resource equips you with the fundamental knowledge needed for effective data analysis. From data interpretation to actionable insights, dive into the world of data analytics with confidence and clarity.
1. MANAGE WORKSHEETS AND WORKBOOKS
Import data into workbooks
Navigate within workbooks
Format worksheets and workbooks
Customize options and views
Configure content for collaboration
2. MANAGE DATA CELLS AND RANGES
Manipulate data in worksheets
Format cells and ranges
Define and reference named ranges
Summarize data visually
3. MANAGE TABLES AND TABLE DATA
Create and format tables
Modify tables
Filter and sort table data
4. PERFORM OPERATIONS BY USING FORMULAS AND FUNCTIONS
Insert references
Calculate and transform datas
Format and modify text
5. MANAGE CHARTS
Modify charts
Format charts
3. CREATE ADVANCED FORMULAS AND MACROS
Perform logical operations in formulas
Look up data by using functions
Use advanced date and time functions
Streamline your data cleaning process with our Core Course: Data Cleaning Automation Through Power Query. Discover the power of automation to efficiently cleanse and prepare your datasets. Learn advanced techniques using Power Query to automate repetitive tasks, enhance data quality, and accelerate your workflow. Gain the skills needed to transform raw data into a refined, analysis-ready state effortlessly.
Dive into the fundamentals of effective data modeling with our Data Modeling 101 Core Course. Learn the essential principles and techniques to structure and organize data for maximum efficiency and relevance. This course empowers you to create robust data models, facilitating accurate analysis and informed decision-making. Elevate your skills in database design and enhance your ability to derive meaningful insights from your data.
Master the art of Data Analysis Expression (DAX) with our Definitive Guide to DAX 102 Core Course. Elevate your analytics proficiency as you delve deeper into advanced DAX functions, enhancing your ability to unlock valuable insights from complex datasets. Gain practical skills to optimize data modeling, streamline calculations, and elevate your decision-making capabilities. Take the next step in mastering DAX and empower your data-driven success.
Dive deep into the world of data visualization and learn how to unleash the power of storytelling with data. Explore advanced techniques to create captivating visualizations that effectively communicate insights and narratives. From choosing the right visualization types to incorporating design principles, you will discover how to transform raw data into compelling stories that engage and inspire your audience. Elevate your data analysis skills by mastering the art of data visualization and leave a lasting impact with your data-driven storytelling abilities.
Empower your sales strategy with Applied Data Analytics: Sales Dashboard. Transform raw data into actionable insights, track key performance metrics, and make informed decisions that drive business growth. Unleash the power of data visualization to enhance sales performance, optimize processes, and elevate your business intelligence. Elevate your sales game with a dynamic and insightful approach to data analytics
Elevate your professional profile and impress future employers or clients with a standout data analysis portfolio. In this module, you will learn how to curate and showcase your best data analysis projects, highlighting your skills, insights, and achievements. From selecting compelling datasets to crafting visually appealing presentations, you will develop the expertise to effectively communicate your data analysis prowess. By the end of this module, you will have a robust portfolio that demonstrates your ability to tackle real-world challenges and deliver valuable results, setting you apart in the competitive data analysis landscape.
Navigate the world of freelancing with confidence through Freelancing 101. This essential guide provides insights into the freelance landscape, offering tips on building a successful career. From securing projects to managing finances, Freelancing 101 equips you with the knowledge and strategies to thrive as an independent professional. Explore the freedom of freelancing and turn your skills into a rewarding and sustainable career.

Bank Name : BPI
Branch : SUBIC – SBMA
Account Name : Abraham J. Avila Jr.
Account No. : 0699 04 7643

G-CASH
0966 502 8685
Abraham Jr Avila
At the end of the training, you are expected to design and develop your own business intelligence solutions capstone project.
Case Study & Project-Based Live Demo. Through real-world case studies and live project demos, gain practical insights into utilizing analytics for strategic HR decision-making. This project-based learning experience serves as a key component for students looking to apply theoretical knowledge in a tangible HR Analytics project. Develop crucial skills, analyze employee data, and enhance your proficiency in driving data-driven HR strategies.
Case Study & Project-Based Live Demo. Sales/Financial Data Analytics Project is designed to equip you with the tools and insights needed to unlock hidden opportunities, identify key trends, optimize strategies, and maximize profitability. Gain a competitive edge as you harness the power of data to make informed decisions, drive revenue growth, and elevate your financial performance to new heights
In a student's own capstone, the emphasis is on individual initiative, creativity, and independent thinking. This type of capstone project provides an opportunity for students to delve deep into a subject area, explore complex problems, propose solutions, and present their findings in a meaningful and comprehensive manner
ENROLLMENT PROCESS:
IMPORTANT: Please review the content on this page and Section 1 of the Enrollment form thoroughly.
1.) SETTLE THE PAYMENT: Please secure your slot by paying corresponding learning fee in the account below:
Bank Name : BPI
Branch: SUBIC – SBMA
Account Name: Abraham J. Avila Jr.
Account No.: 0699 04 7643
G-CASH
0966 502 8685
Abraham Jr Avila
Bank Name: UNIONBANK OF THE PHILIPPINES
Account Name: DATASENSE ANALYTICS INC
Account No.: 0019 3001 0774
CHECKING ACCOUNT
2.) UPLOAD PROOF OF PAYMENT: Please upload a photo or screenshot of your receipt in this enrollment form as your proof of payment.
*IMPORTANT: Please complete the enrollment form promptly after making your payment.
3.) SEND US A MESSAGE: Once paid and reregistered, please submit the proof of payment to DataSense Analytics Official Page < https://www.facebook.com/datasenseph>.
NOTE: Within 2 business days prior to the start of program you will receive an Official Admission confirmation email and/or FB Message from DataSense Analytics.
4.) While waiting for your official Admission Letter, we recommend watching this video: — A No nonsense Roadmap to Become a Data Analyst: https://www.youtube.com/watch?v=nkSwn4xNRBA&t=529s
This will give you a strong foundation and clarity on the journey ahead. By doing this, we can skip the theoretical basics once the program begins and dive straight into the core content of the course.
5.) Begin and complete the course within given period.
Yes, absolutely! Our Data Analytics Training is designed for individuals with all levels of experience, including those with zero knowledge in data analytics and MS Excel. Our comprehensive curriculum starts from the fundamentals and gradually builds your skills, ensuring that you can confidently navigate the world of data analytics, regardless of your prior knowledge. Our experienced instructors and hands-on learning approach will provide you with the necessary support and guidance to succeed in the Training, regardless of your starting point.
You can use a laptop or PC running on a Windows operating system for the Data Analytics Training. Windows OS is fully compatible with the tools and software used in the Training, including Power Query, Power Pivot, and DAX.
Note: MACOS does NOT support Power Query, Data Modeling, DAX, and Power Pivot
To receive the Certificate of Completion, you must fulfill the following requirements:
Graded exams: You need to pass all graded exams with a minimum score of 80% on each exam. These exams are designed to assess your understanding and proficiency in the key concepts and skills covered in the Training.
Capstone project: Alternatively, you can develop your own capstone project as a demonstration of your practical application of the knowledge and skills gained throughout the Training. Your project should showcase your ability to analyze data, derive insights, and present your findings effectively.
Copyright © DataSense Analytics. Any illegal reproduction of our training content in any form will result in immediate action to the person concerned. This content is NOT allowed for resell and illegal distribution in any forms.
If you agree with the terms and condition and wish to join with our program, please sign up by clicking ENROLL NOW button.
